Microservice Solution: Monitoring
In a distributed system it is important to monitor the health of the system and the services. Monitoring helps to detect issues before they become problems and helps to understand the system's behavior. All the services, applications and gateways are configured to use the Prometheus and Grafana libraries for monitoring. They are configured in a common way for monitoring. This document explains that common monitoring structure.
Configuration
The monitoring configuration is done in the each Module class of the project. The OnApplicationInitialization method of the module class is used to set the monitoring system. We're adding the prometheus-net.AspNetCore package to the project to use Prometheus. The prometheus-net.AspNetCore package is a library that provides a middleware to expose metrics for Prometheus. The app.UseHttpMetrics(); line is collect the HTTP request metrics. The endpoints.MapMetrics(); line is used to expose the metrics to the /metrics endpoint. Existing templates includes the prometheus and grafana configurations in the docker-compose file. So, you can visit the http://localhost:9090 to see the Prometheus dashboard and http://localhost:3001 to see the Grafana dashboard.
Default username and password for Grafana is
adminandadmin. You can change the password after the first login.
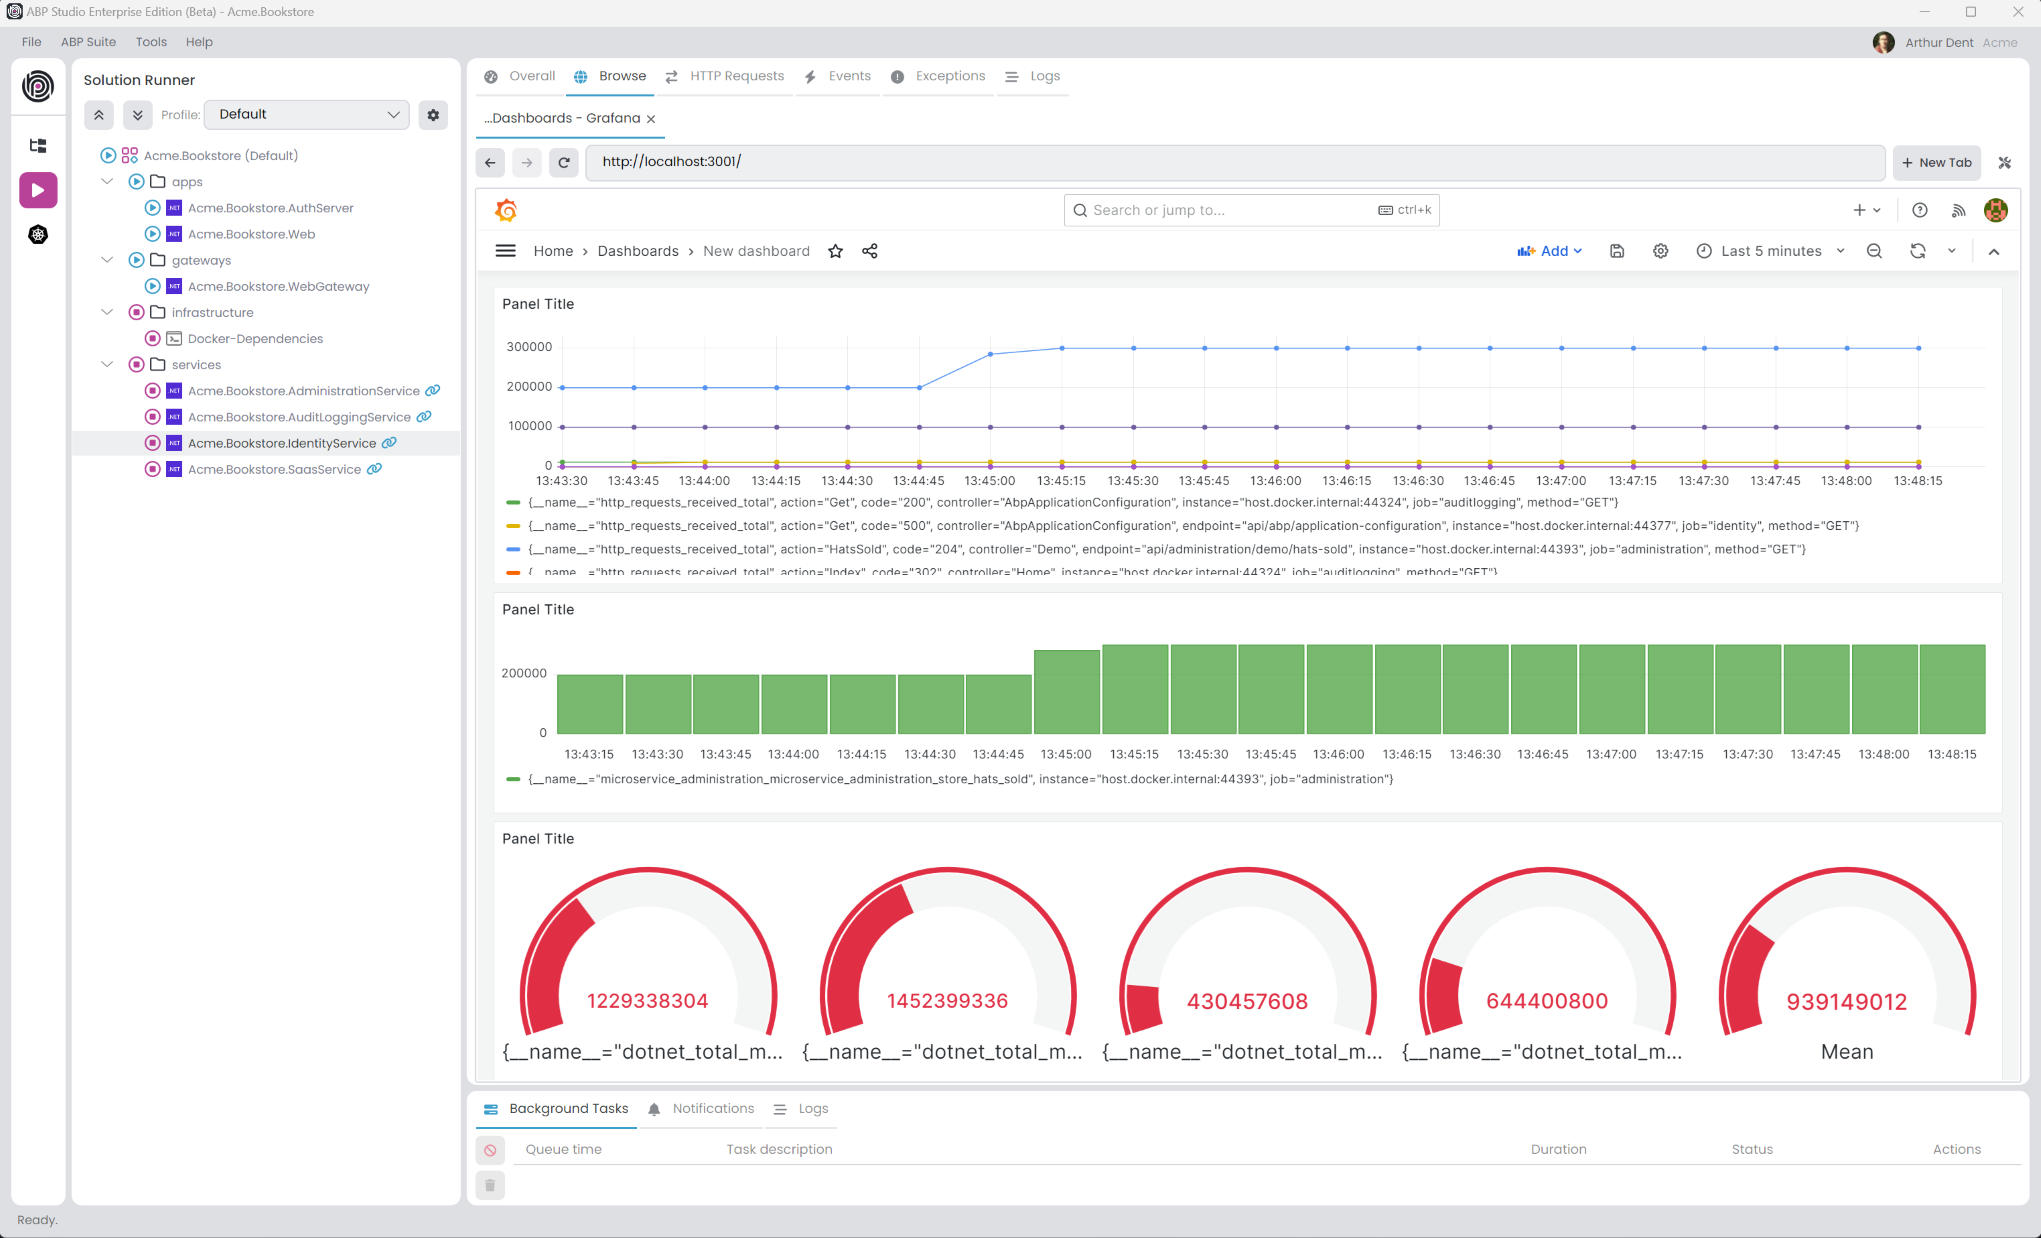
After you login to the Grafana dashboard, you can add a new data source to connect to the Prometheus server and create a new dashboard to monitor the system.
Custom Metrics
To create custom metrics, you can use the IMeterFactory interface. Basically, you can follow the steps in the official documentation to create custom metrics. For example, you can create a custom metric to monitor the number of requests to a specific endpoint.
public class AdministrationMetrics : ISingletonDependency
{
    private readonly Counter<int> _demoRequested;

    public AdministrationMetrics(IMeterFactory meterFactory)
    {
        var meter = meterFactory.Create("Microservice.Administration");
        _demoRequested = meter.CreateCounter<int>("demo_controller.requested");
    }

    public void DemoRequested()
    {
        _demoRequested.Add(1);
    }
}
In the demo controller, you can inject the AdministrationMetrics class and use the DemoRequested method to increase the counter.
[Route("api/administration/demo")]
public class DemoController : AbpController
{
    public AdministrationMetrics AdministrationMetrics { get; }

    public DemoController(AdministrationMetrics administrationMetrics)
    {
        AdministrationMetrics = administrationMetrics;
    }

    [HttpGet]
    [Route("requested")]
    public  Task DemoRequested()
    {
        AdministrationMetrics.DemoRequested();
        return Task.CompletedTask;
    }
}
Kubernetes Monitoring
If you check the Kubernetes Configuration option during project creation, the monitoring system is automatically configured for Kubernetes. The prometheus and grafana configurations are added to the helm chart.
